After a week of sketching and many many iterations, I'm finally ready to implement the SVG base for the Life of Plastic data visualization. I've split up all the SVGs into several TypeScript components to help with organizing and later customizing them.
First challenge is figuring out how to get the SVG to load on this page. Something with TypeScript is creating problems importing the JSX. And of course it turns out that I forgot to capitalize the component.
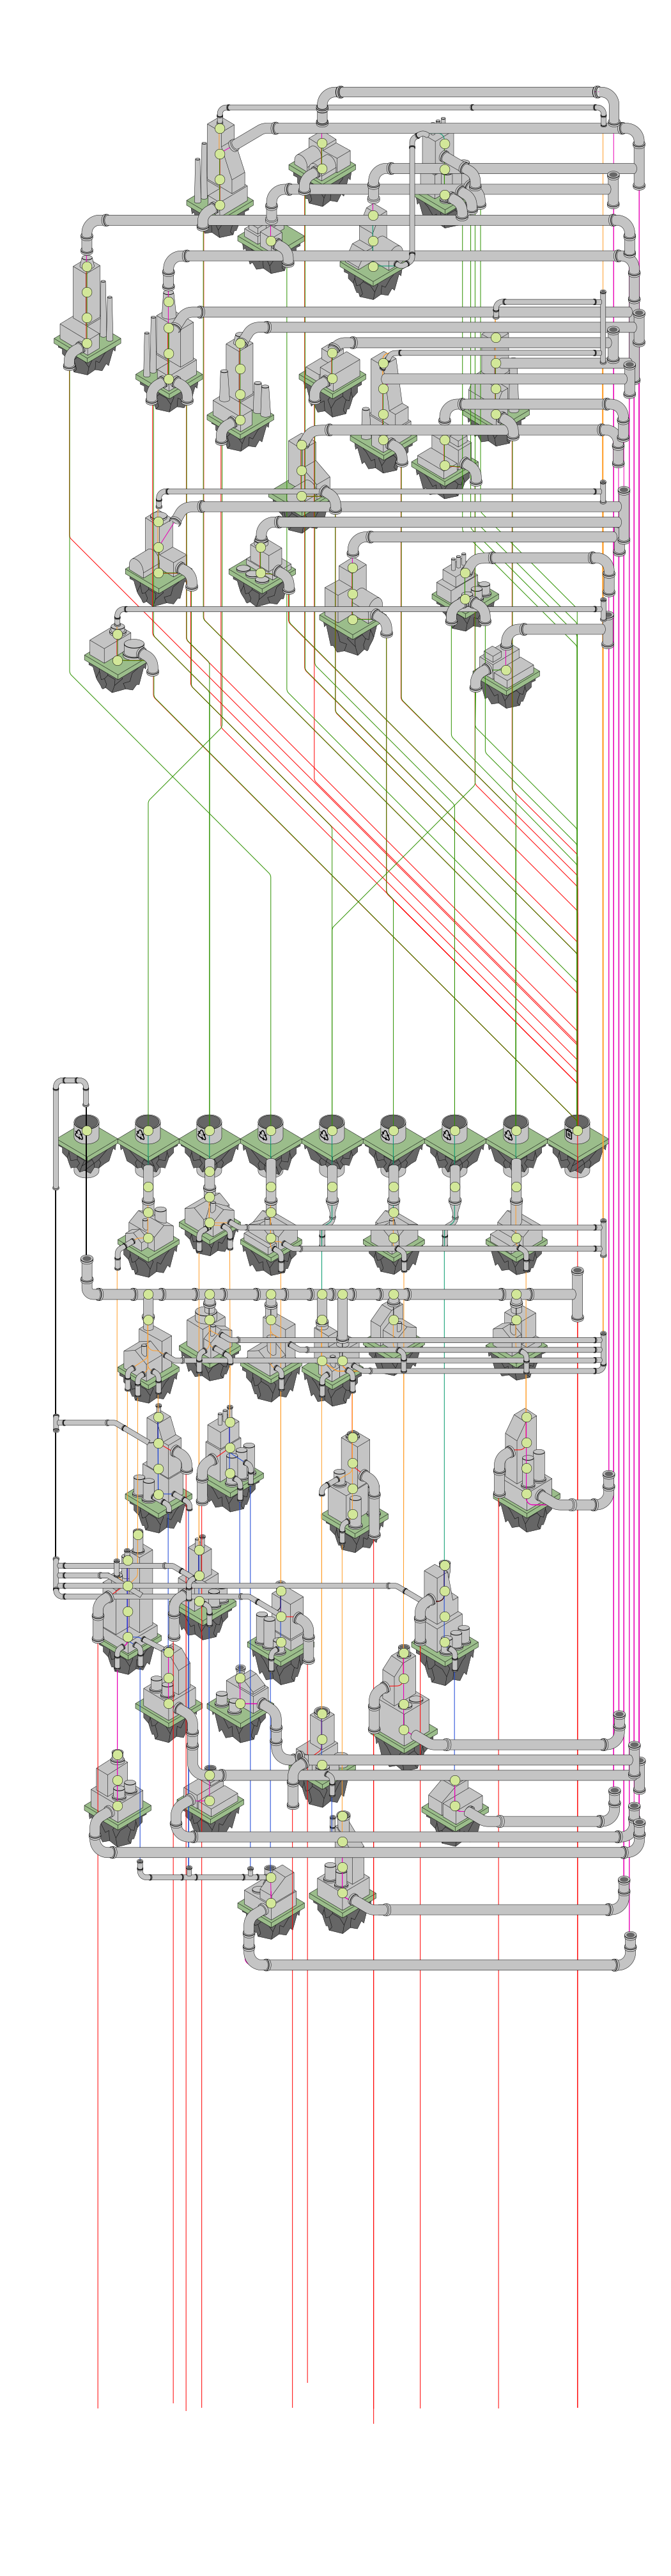
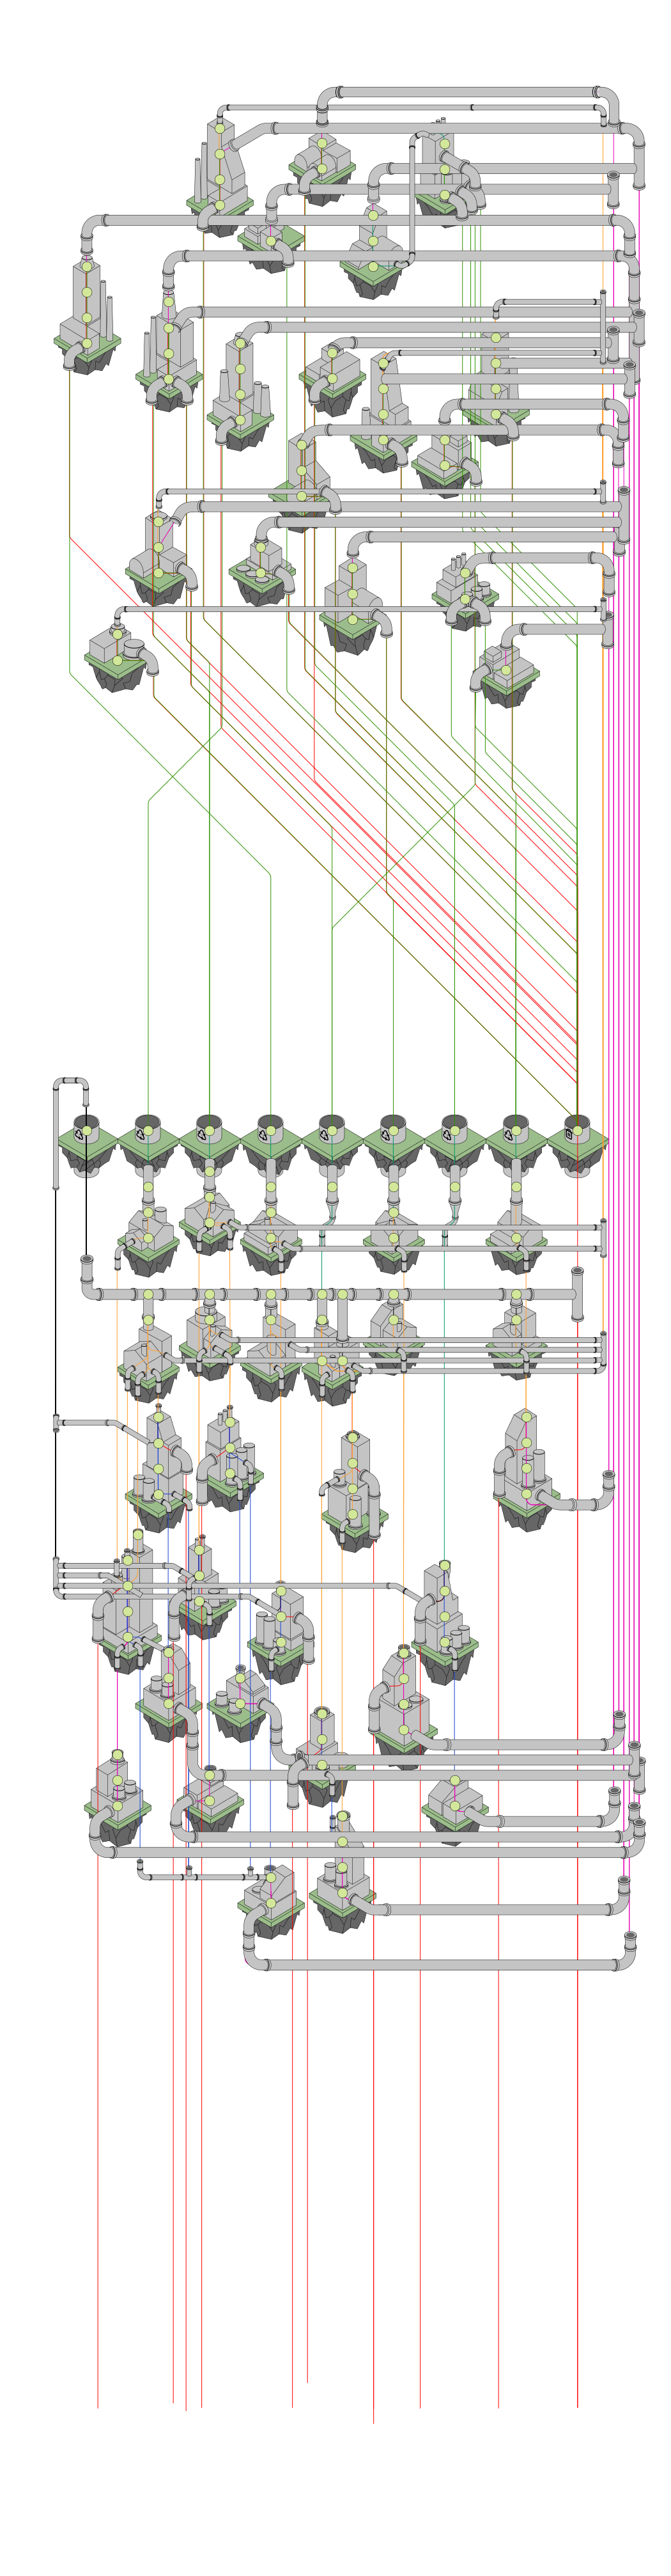
Open the original illustration at full size